Who registered to vote, but did not vote?
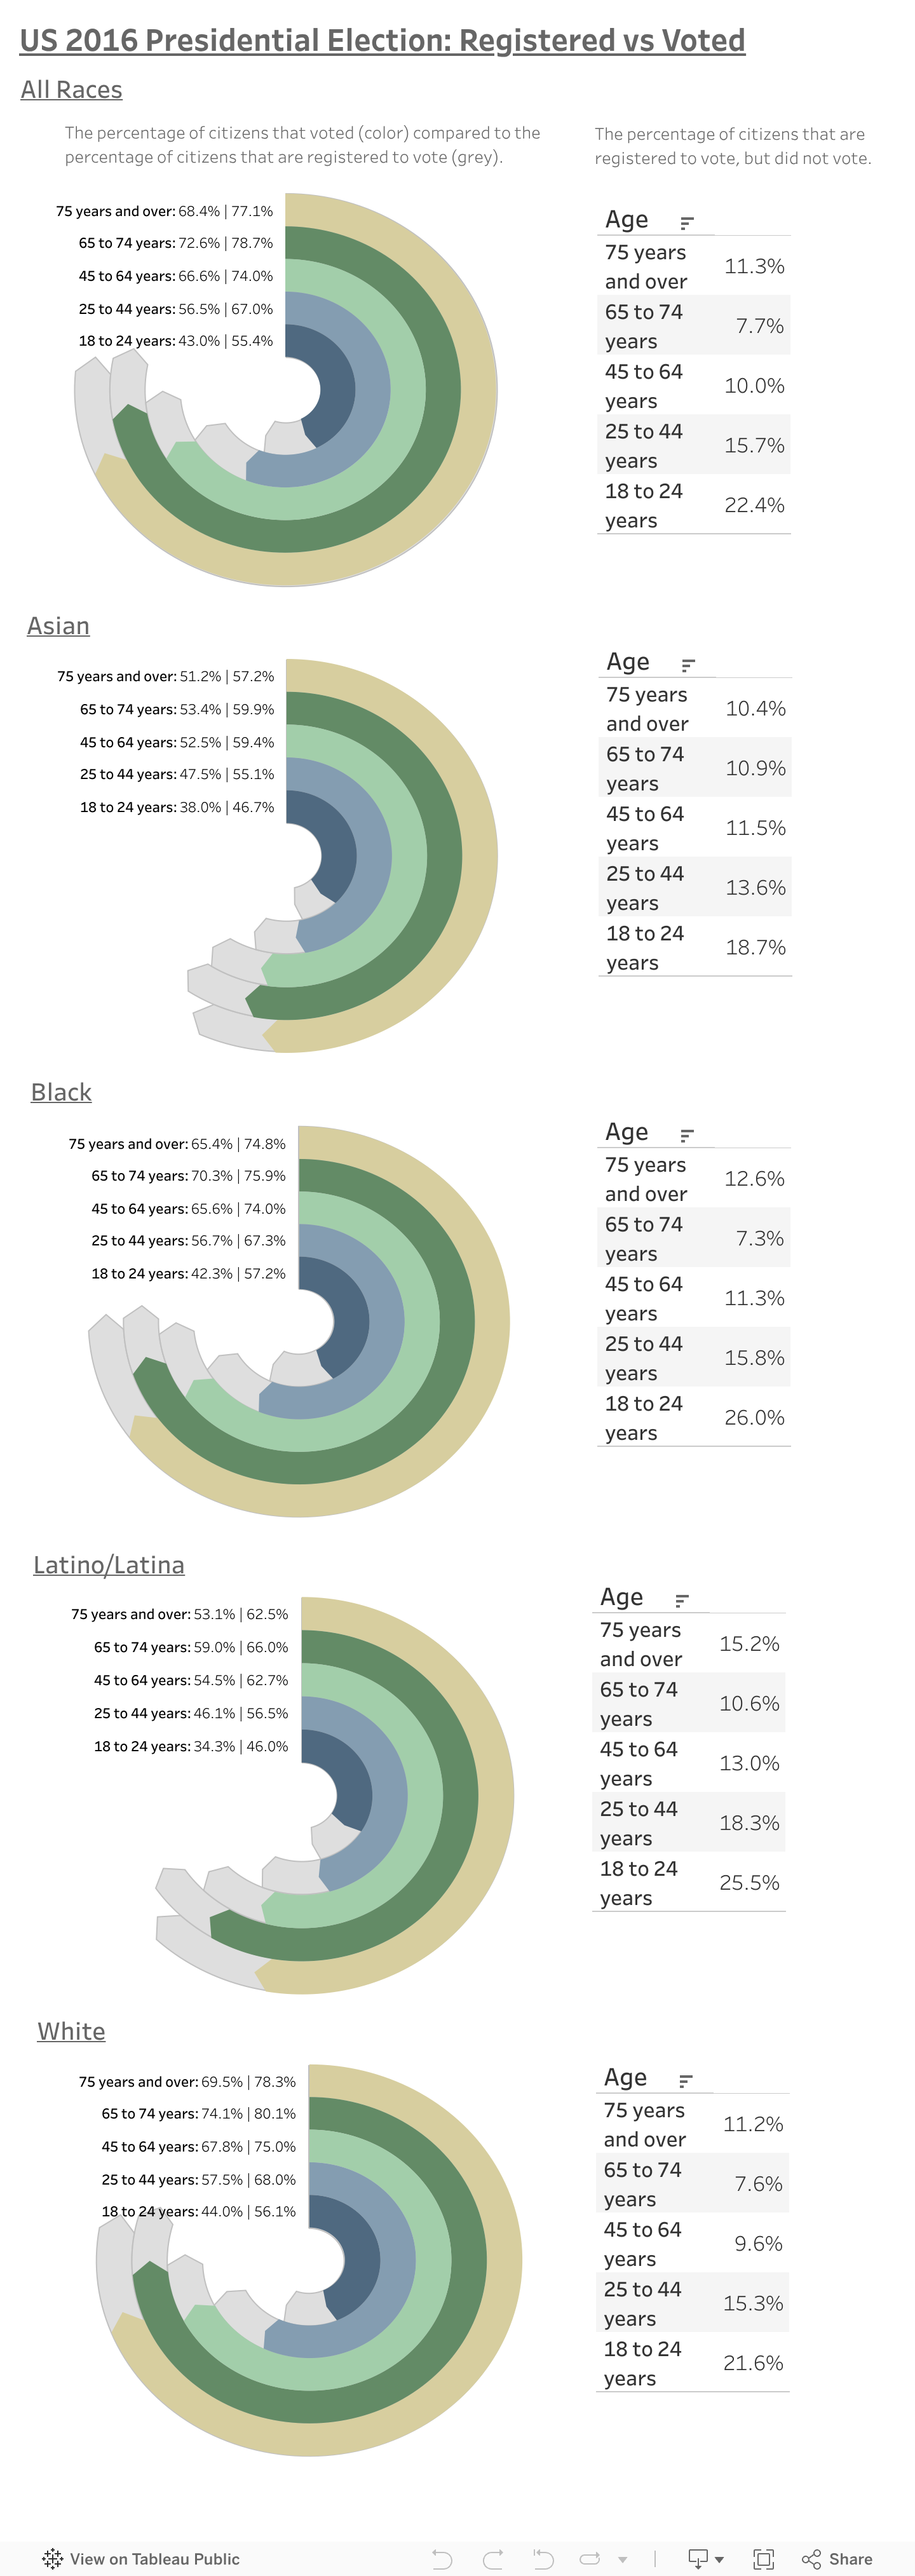
How many people were registered to vote, but did not vote in the 2016 US presidential election? The figures below shows the percentage of citizens that are registered to vote and the percentage of citizens that actually voted. This visualization was created to spark conversation about registering to vote and showing up at the polls or submitting mail-in ballots.
Key insights:
- The 65 to 74 years old age group has the highest percentage of registered voters (78.7%) and the highest turnout among those registered (92.3%).
- The 18 to 24 years old age group has the smallest percentage of registered voters (55.4%), in addition to having the highest percentage of people that are registered and did not vote (22.4%).
- From the 18 to 24 years old age group, there are a higher percentage of Black registered voters (57.2%) than any other race, but also a the highest percentage of those registered and did not vote (26%).
- Asian citizens are the least likely to be registered voters, but of those registered in the 18 to 24 and 25 to 44 age group, there are higher turnouts (81.3% and 86.4%, respectively) than other races.
Programs used:
- Tableau was used for the visualizations.
- Excel was used for data cleaning.
Resources:
- Data was imported from census.gov


Comments
Post a Comment